Market Terminal
Trading terminal with two marquee tapes running in opposite directions, swipeable chart cards and a watchlist that follows them.
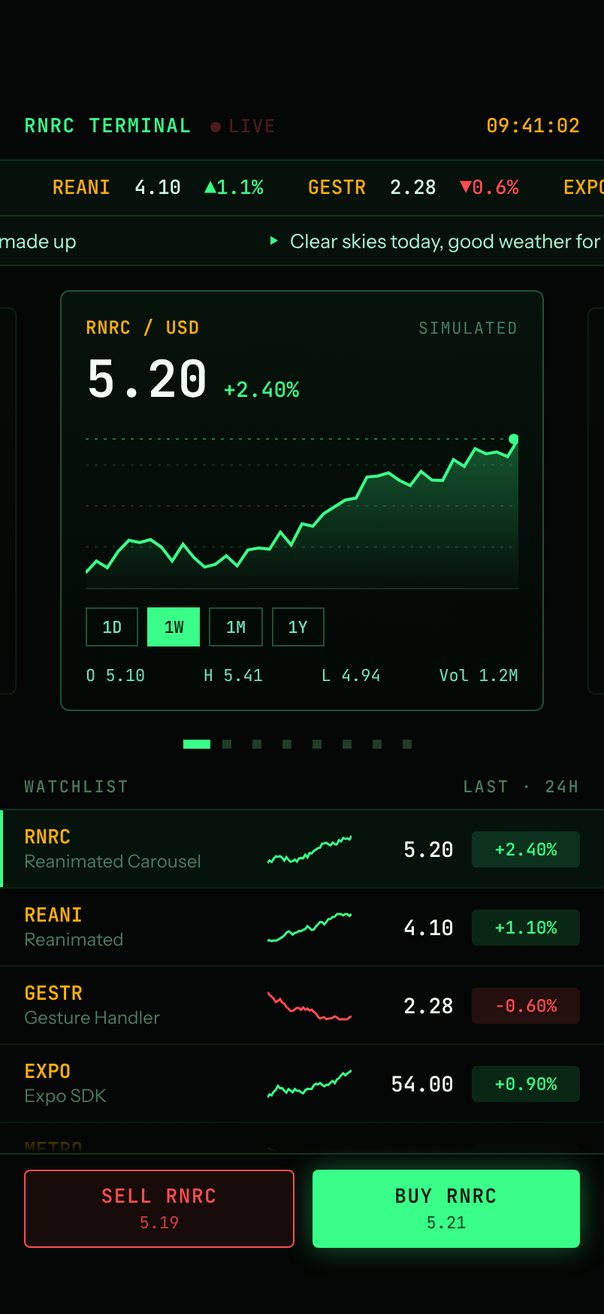
Live demo. Drag it, tap it.
How it works
- Both tapes are
autoplaycarousels withautoplayInterval={0}, linear timing andscrollEnabled={false}: 2600 ms per 170 pt quote, and 4400 ms per 320 pt headline withautoplayDirection="backward". - The chart cards loop with
itemSizeset to the screen width minus 64 and autoplay every 3000 ms;itemAnimationscales the neighbors to 0.92 and fades them to 0.35. progressdrives thePagination, the highlighted watchlist row and the BUY/SELL bar, and tapping a row callsscrollTo({ index }).
Uses
Full source
import type { SceneFont } from "@/features/scenes/fonts";
import { SceneScreen, useScene } from "@/features/scenes/kit";
import { LinearGradient } from "expo-linear-gradient";
import * as React from "react";
import { Pressable, ScrollView, StyleSheet, Text, View } from "react-native";
import Animated, {
	Easing,
	Extrapolation,
	type SharedValue,
	interpolate,
	useAnimatedReaction,
	useAnimatedStyle,
	useSharedValue,
	withRepeat,
	withTiming,
} from "react-native-reanimated";
import {
	Carousel,
	type CarouselItemAnimation,
	type CarouselRef,
	type CarouselRenderItem,
	Pagination,
} from "react-native-reanimated-carousel";
import Svg, {
	Circle,
	Defs,
	Line,
	Path,
	Stop,
	LinearGradient as SvgGradient,
} from "react-native-svg";
import { scheduleOnRN } from "react-native-worklets";

interface Ticker {
	symbol: string;
	name: string;
	price: number;
	change: number; // percent today
}

// Every number here is made up.
const TICKERS: Ticker[] = [
	{ symbol: "RNRC", name: "Reanimated Carousel", price: 5.2, change: 2.4 },
	{ symbol: "REANI", name: "Reanimated", price: 4.1, change: 1.1 },
	{ symbol: "GESTR", name: "Gesture Handler", price: 2.28, change: -0.6 },
	{ symbol: "EXPO", name: "Expo SDK", price: 54.0, change: 0.9 },
	{ symbol: "METRO", name: "Metro Bundler", price: 0.83, change: -1.8 },
	{ symbol: "HRMS", name: "Hermes Engine", price: 0.12, change: 3.2 },
	{ symbol: "WRKLT", name: "Worklets", price: 0.52, change: 0.4 },
	{ symbol: "SVG", name: "React Native SVG", price: 15.12, change: -0.3 },
];

const NEWS = [
	"Clear skies today, good weather for carousels",
	"Loop layout uptime hits 99.99%",
	"Interest in nearest snapping keeps rising",
	"Top gesture today: the quick swipe",
	"A marquee is just autoplayInterval = 0",
	"All numbers here are made up",
];

const FRAMES = ["1D", "1W", "1M", "1Y"];
const GREEN = "#39FF88";
const RED = "#FF4D4D";
const AMBER = "#FFB000";
const RULE = "#12301E";
const EDGE = "#1F5135";
const MUTED = "#4B7A5E";

const fmt = (n: number) => n.toFixed(2);
const signed = (n: number) => `${n < 0 ? "−" : "+"}${Math.abs(n).toFixed(2)}%`;
const arrow = (n: number) => `${n < 0 ? "▼" : "▲"}${Math.abs(n).toFixed(1)}%`;
const tint = (t: Ticker) => (t.change < 0 ? RED : GREEN);

/** Seeded random walk (0–100): gainers drift up, losers drift down. */
function walk(seed: number, up: boolean) {
	let s = seed;
	let v = 50;
	return Array.from({ length: 41 }, () => {
		s = (Math.imul(s, 1664525) + 1013904223) >>> 0;
		v = Math.min(
			92,
			Math.max(8, v + (s / 4294967296 - (up ? 0.42 : 0.58)) * 9),
		);
		return v;
	});
}
const WALKS = TICKERS.map((t, i) => walk(i * 19 + 5, t.change >= 0));

// ---------- pieces ----------

type ChartProps = {
	index: number;
	width: number;
	height: number;
	detailed?: boolean;
};
function Chart({ index, width, height, detailed }: ChartProps) {
	const values = WALKS[index];
	const color = tint(TICKERS[index]);
	const pad = detailed ? 10 : 2;
	const lo = Math.min(...values);
	const hi = Math.max(...values);
	const pts = values.map((v, k) => [
		(k / (values.length - 1)) * width,
		height - pad - ((v - lo) / (hi - lo)) * (height - pad * 2),
	]);
	const line = `M${pts.map(([x, y]) => `${x.toFixed(1)},${y.toFixed(1)}`).join(" L")}`;
	const [endX, endY] = pts[pts.length - 1];
	const rule = { x1: 0, x2: width, strokeDasharray: "2 4" };
	return (
		<Svg width={width} height={height}>
			{detailed && (
				<>
					<Defs>
						<SvgGradient id={`fill-${index}`} x1="0" y1="0" x2="0" y2="1">
							<Stop offset="0" stopColor={color} stopOpacity={0.3} />
							<Stop offset="1" stopColor={color} stopOpacity={0.02} />
						</SvgGradient>
					</Defs>
					{[0.25, 0.5, 0.75].map((f) => (
						<Line
							key={f}
							{...rule}
							y1={height * f}
							y2={height * f}
							stroke={RULE}
						/>
					))}
					<Path
						d={`${line} L${width},${height} L0,${height} Z`}
						fill={`url(#fill-${index})`}
					/>
					<Line
						{...rule}
						y1={endY}
						y2={endY}
						stroke={color}
						strokeOpacity={0.45}
					/>
					<Circle cx={endX - 3} cy={endY} r={3.5} fill={color} />
				</>
			)}
			<Path
				d={line}
				fill="none"
				stroke={color}
				strokeWidth={detailed ? 2 : 1.5}
			/>
		</Svg>
	);
}

type CardProps = {
	ticker: Ticker;
	index: number;
	width: number;
	chartH: number;
};
const ChartCard = React.memo(function ChartCard({
	ticker,
	index,
	width,
	chartH,
}: CardProps) {
	const { symbol, price } = ticker;
	const stats = [
		`O ${fmt(price * 0.98)}`,
		`H ${fmt(price * 1.04)}`,
		`L ${fmt(price * 0.95)}`,
		`Vol ${(index * 3.7 + 1.2).toFixed(1)}M`,
	];
	return (
		<LinearGradient
			colors={["#06130B", "#030805"]}
			style={[styles.card, { width }]}
		>
			<View style={styles.spread}>
				<Text style={styles.pair}>{symbol} / USD</Text>
				<Text style={styles.simulated}>SIMULATED</Text>
			</View>
			<View style={styles.priceRow}>
				<Text style={styles.price}>{fmt(price)}</Text>
				<Text style={[styles.change, { color: tint(ticker) }]}>
					{signed(ticker.change)}
				</Text>
			</View>
			<View style={styles.chart}>
				<Chart index={index} width={width - 34} height={chartH} detailed />
			</View>
			<View style={styles.frames}>
				{FRAMES.map((f) => (
					<View key={f} style={[styles.frame, f === "1W" && styles.frameOn]}>
						<Text style={[styles.frameText, f === "1W" && styles.frameTextOn]}>
							{f}
						</Text>
					</View>
				))}
			</View>
			<View style={styles.spread}>
				{stats.map((s) => (
					<Text key={s} style={styles.stat}>
						{s}
					</Text>
				))}
			</View>
		</LinearGradient>
	);
});

const renderQuote: CarouselRenderItem<Ticker> = ({ item }) => (
	<Text style={styles.quote}>
		<Text style={styles.symbol}>{item.symbol}</Text>
		{`  ${fmt(item.price)}  `}
		<Text style={{ color: tint(item) }}>{arrow(item.change)}</Text>
	</Text>
);

const renderHeadline: CarouselRenderItem<string> = ({ item }) => (
	<View style={styles.headline}>
		<View style={styles.bullet} />
		<Text style={styles.headlineText} numberOfLines={1}>
			{item}
		</Text>
	</View>
);

function Live() {
	const opacity = useSharedValue(0.9);
	React.useEffect(() => {
		opacity.value = withRepeat(
			withTiming(0.25, { duration: 800, easing: Easing.inOut(Easing.ease) }),
			-1,
			true,
		);
	}, [opacity]);
	const style = useAnimatedStyle(() => ({ opacity: opacity.value }));
	return (
		<Animated.View style={[styles.live, style]}>
			<View style={styles.liveDot} />
			<Text style={styles.liveText}>LIVE</Text>
		</Animated.View>
	);
}

function Clock() {
	const [now, setNow] = React.useState(() => new Date());
	React.useEffect(() => {
		const timer = setInterval(() => setNow(new Date()), 1000);
		return () => clearInterval(timer);
	}, []);
	return <Text style={styles.clock}>{now.toTimeString().slice(0, 8)}</Text>;
}

type RowProps = {
	index: number;
	progress: SharedValue<number>;
	onPress: (index: number) => void;
};
function WatchRow({ index, progress, onPress }: RowProps) {
	const ticker = TICKERS[index];
	// The row lights up while its chart card is in the middle.
	const activeStyle = useAnimatedStyle(() => {
		const n = TICKERS.length;
		const r = (((progress.value - index) % n) + n) % n;
		return { opacity: Math.max(0, 1 - Math.min(r, n - r)) };
	});
	return (
		<Pressable
			accessibilityLabel={ticker.name}
			onPress={() => onPress(index)}
			style={styles.row}
		>
			<Animated.View style={[styles.rowActive, activeStyle]} />
			<View style={styles.rowName}>
				<Text style={styles.rowSymbol}>{ticker.symbol}</Text>
				<Text style={styles.rowCompany} numberOfLines={1}>
					{ticker.name}
				</Text>
			</View>
			<Chart index={index} width={56} height={22} />
			<Text style={styles.rowPrice}>{fmt(ticker.price)}</Text>
			<View style={[styles.badge, { backgroundColor: `${tint(ticker)}22` }]}>
				<Text style={[styles.badgeText, { color: tint(ticker) }]}>
					{signed(ticker.change)}
				</Text>
			</View>
		</Pressable>
	);
}

function TradeBar({ ticker }: { ticker: Ticker }) {
	return (
		<View style={styles.trade}>
			<Pressable
				style={({ pressed }) => [
					styles.tradeButton,
					styles.sell,
					pressed && styles.pressed,
				]}
			>
				<Text style={[styles.tradeLabel, { color: RED }]}>
					SELL {ticker.symbol}
				</Text>
				<Text style={[styles.tradePrice, { color: RED }]}>
					{fmt(ticker.price * 0.998)}
				</Text>
			</Pressable>
			<Pressable
				style={({ pressed }) => [
					styles.tradeButton,
					styles.buy,
					pressed && styles.pressed,
				]}
			>
				<Text style={styles.tradeLabel}>BUY {ticker.symbol}</Text>
				<Text style={styles.tradePrice}>{fmt(ticker.price * 1.002)}</Text>
			</Pressable>
		</View>
	);
}

// ---------- screen ----------

function Terminal() {
	const { width, insets } = useScene();
	const charts = React.useRef<CarouselRef>(null);
	const progress = useSharedValue(0);
	const [active, setActive] = React.useState(0);

	const itemSize = width - 64;
	const cardW = itemSize - 16;
	const chartH = Math.round(cardW * 0.34);
	const cardH = chartH + 172; // header, price, chart, timeframes and stats

	// The trade bar follows whichever card is closest to the middle.
	useAnimatedReaction(
		() =>
			((Math.round(progress.value) % TICKERS.length) + TICKERS.length) %
			TICKERS.length,
		(now, before) => {
			if (now !== before) scheduleOnRN(setActive, now);
		},
	);

	const itemAnimation = React.useCallback<CarouselItemAnimation>(
		(value) => {
			"worklet";
			const d = Math.abs(value);
			return {
				transform: [
					{ translateX: value * itemSize + (width - itemSize) / 2 },
					{ scale: interpolate(d, [0, 1], [1, 0.92], Extrapolation.CLAMP) },
				],
				opacity: interpolate(d, [0, 1], [1, 0.35], Extrapolation.CLAMP),
			};
		},
		[itemSize, width],
	);

	const renderChart = React.useCallback<CarouselRenderItem<Ticker>>(
		({ item, index }) => (
			<View style={styles.slot}>
				<ChartCard ticker={item} index={index} width={cardW} chartH={chartH} />
			</View>
		),
		[cardW, chartH],
	);

	const select = React.useCallback(
		(index: number) => charts.current?.scrollTo({ index }),
		[],
	);

	return (
		<View
			style={[
				styles.screen,
				{ paddingTop: insets.top, paddingBottom: insets.bottom },
			]}
		>
			<View style={styles.header}>
				<Text style={styles.brand}>RNRC TERMINAL</Text>
				<Live />
				<Clock />
			</View>

			{/* Marquees: autoplay with no pause between steps and linear timing. */}
			<View style={styles.tape}>
				<Carousel
					data={TICKERS}
					loop
					autoplay
					autoplayInterval={0}
					scrollEnabled={false}
					itemSize={170}
					style={{ width, height: 36 }}
					animation={{ type: "timing", duration: 2600, easing: Easing.linear }}
					renderItem={renderQuote}
				/>
			</View>
			<View style={[styles.tape, styles.newsTape]}>
				<Carousel
					data={NEWS}
					loop
					autoplay
					autoplayInterval={0}
					autoplayDirection="backward"
					scrollEnabled={false}
					itemSize={320}
					style={{ width, height: 32 }}
					animation={{ type: "timing", duration: 4400, easing: Easing.linear }}
					renderItem={renderHeadline}
				/>
			</View>

			<Carousel
				ref={charts}
				data={TICKERS}
				loop
				autoplay
				autoplayInterval={3000}
				itemSize={itemSize}
				style={{ width, height: cardH + 4, marginTop: 16 }}
				progress={progress}
				itemAnimation={itemAnimation}
				renderItem={renderChart}
			/>
			<Pagination
				count={TICKERS.length}
				progress={progress}
				onPress={select}
				containerStyle={styles.dots}
				dotStyle={{
					width: 6,
					height: 6,
					borderRadius: 0,
					backgroundColor: "#1F3B2A",
				}}
				activeDotStyle={{ width: 18, backgroundColor: GREEN }}
			/>

			<View style={styles.listHead}>
				<Text style={styles.listTitle}>WATCHLIST</Text>
				<Text style={styles.listTitle}>LAST · 24H</Text>
			</View>
			<View style={styles.list}>
				<ScrollView showsVerticalScrollIndicator={false}>
					{TICKERS.map((t, i) => (
						<WatchRow
							key={t.symbol}
							index={i}
							progress={progress}
							onPress={select}
						/>
					))}
				</ScrollView>
				<LinearGradient colors={["#04070500", "#040705"]} style={styles.fade} />
			</View>

			<TradeBar ticker={TICKERS[active]} />
		</View>
	);
}

const FONTS: SceneFont[] = [
	"Instrument-Regular",
	"Instrument-Medium",
	"JetBrainsMono-Regular",
	"JetBrainsMono-Medium",
	"JetBrainsMono-SemiBold",
];

export default function Scene() {
	return (
		<SceneScreen background="#040705" statusBar="light" fonts={FONTS}>
			<Terminal />
		</SceneScreen>
	);
}

const font = (
	fontFamily: SceneFont,
	fontSize: number,
	color: string,
	lineHeight: number,
) => ({
	fontFamily,
	fontSize,
	color,
	lineHeight,
});

const across = { flexDirection: "row", alignItems: "center" } as const;
const spread = { ...across, justifyContent: "space-between" } as const;
const underline = { borderBottomWidth: 1, borderColor: RULE } as const;
const overline = { borderTopWidth: 1, borderColor: RULE } as const;

const styles = StyleSheet.create({
	screen: { flex: 1 },
	header: { ...across, height: 44, gap: 12, paddingHorizontal: 16 },
	brand: {
		...font("JetBrainsMono-SemiBold", 13, GREEN, 16),
		letterSpacing: 0.8,
	},
	live: { ...across, gap: 5 },
	liveDot: { width: 7, height: 7, borderRadius: 4, backgroundColor: RED },
	liveText: {
		...font("JetBrainsMono-Medium", 12, RED, 16),
		letterSpacing: 0.8,
	},
	clock: { ...font("JetBrainsMono-Medium", 13, AMBER, 16), marginLeft: "auto" },
	tape: {
		borderTopWidth: 1,
		borderBottomWidth: 1,
		borderColor: RULE,
		backgroundColor: "#07110B",
	},
	newsTape: { borderTopWidth: 0 },
	quote: {
		...font("JetBrainsMono-Medium", 13, "#D1FAE5", 36),
		paddingLeft: 14,
	},
	symbol: { color: AMBER },
	headline: { ...across, flex: 1, gap: 8, paddingLeft: 14 },
	bullet: {
		borderLeftWidth: 5,
		borderTopWidth: 3.5,
		borderBottomWidth: 3.5,
		borderLeftColor: GREEN,
		borderTopColor: "transparent",
		borderBottomColor: "transparent",
	},
	headlineText: {
		...font("Instrument-Regular", 13, "#A7F3D0", 18),
		flexShrink: 1,
	},
	slot: { flex: 1, alignItems: "center" },
	card: { borderRadius: 6, borderWidth: 1, borderColor: EDGE, padding: 16 },
	spread,
	pair: {
		...font("JetBrainsMono-SemiBold", 12, AMBER, 16),
		letterSpacing: 0.4,
	},
	simulated: {
		...font("JetBrainsMono-Regular", 11, MUTED, 16),
		letterSpacing: 0.8,
	},
	priceRow: { ...across, alignItems: "baseline", gap: 10, marginTop: 6 },
	price: font("JetBrainsMono-SemiBold", 34, "#F0FFF4", 40),
	change: font("JetBrainsMono-Medium", 14, GREEN, 18),
	chart: { ...underline, marginTop: 10 },
	frames: { ...across, gap: 6, marginVertical: 12 },
	frame: {
		height: 26,
		paddingHorizontal: 10,
		justifyContent: "center",
		borderWidth: 1,
		borderColor: EDGE,
	},
	frameOn: { backgroundColor: GREEN, borderColor: GREEN },
	frameText: font("JetBrainsMono-Medium", 11, "#6EE7B7", 14),
	frameTextOn: { color: "#04130A" },
	stat: font("JetBrainsMono-Regular", 11, "#6EE7B7", 14),
	dots: { alignSelf: "center", gap: 2, marginTop: 14 },
	listHead: {
		...spread,
		...underline,
		marginTop: 18,
		paddingHorizontal: 16,
		paddingBottom: 8,
	},
	listTitle: {
		...font("JetBrainsMono-Medium", 11, MUTED, 14),
		letterSpacing: 1.2,
	},
	list: { flex: 1 },
	fade: {
		position: "absolute",
		left: 0,
		right: 0,
		bottom: 0,
		height: 28,
		pointerEvents: "none",
	},
	row: {
		...across,
		...underline,
		height: 52,
		gap: 12,
		paddingHorizontal: 16,
		borderColor: "#0B1F14",
	},
	rowActive: {
		...StyleSheet.absoluteFillObject,
		backgroundColor: "#39FF880D",
		borderLeftWidth: 2,
		borderColor: GREEN,
	},
	rowName: { flex: 1 },
	rowSymbol: font("JetBrainsMono-SemiBold", 13, AMBER, 17),
	rowCompany: font("Instrument-Regular", 12, MUTED, 16),
	rowPrice: {
		...font("JetBrainsMono-Medium", 14, "#F0FFF4", 18),
		width: 56,
		textAlign: "right",
	},
	badge: {
		width: 72,
		height: 24,
		borderRadius: 3,
		alignItems: "center",
		justifyContent: "center",
	},
	badgeText: font("JetBrainsMono-Medium", 11.5, GREEN, 14),
	trade: {
		...across,
		...overline,
		gap: 12,
		paddingHorizontal: 16,
		paddingVertical: 10,
	},
	tradeButton: {
		flex: 1,
		height: 52,
		borderRadius: 4,
		alignItems: "center",
		justifyContent: "center",
	},
	sell: { borderWidth: 1, borderColor: RED, backgroundColor: "#FF4D4D14" },
	buy: {
		backgroundColor: GREEN,
		boxShadow: "0 0 18px rgba(57, 255, 136, 0.35)",
	},
	pressed: { opacity: 0.7 },
	tradeLabel: {
		...font("JetBrainsMono-SemiBold", 13, "#04130A", 16),
		letterSpacing: 0.8,
	},
	tradePrice: {
		...font("JetBrainsMono-Regular", 11, "#04130A", 14),
		marginTop: 2,
		opacity: 0.8,
	},
});